Vinzenz Reinhardt is an interaction designer and media artist.
His work investigates the intersection of art, technology and design.
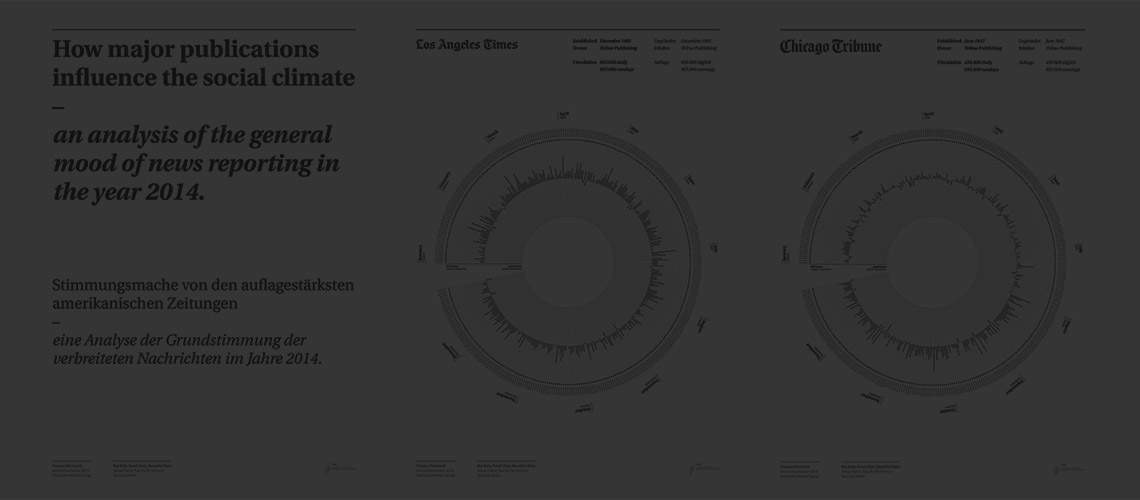 Dystopia
 2015 big data visualisation
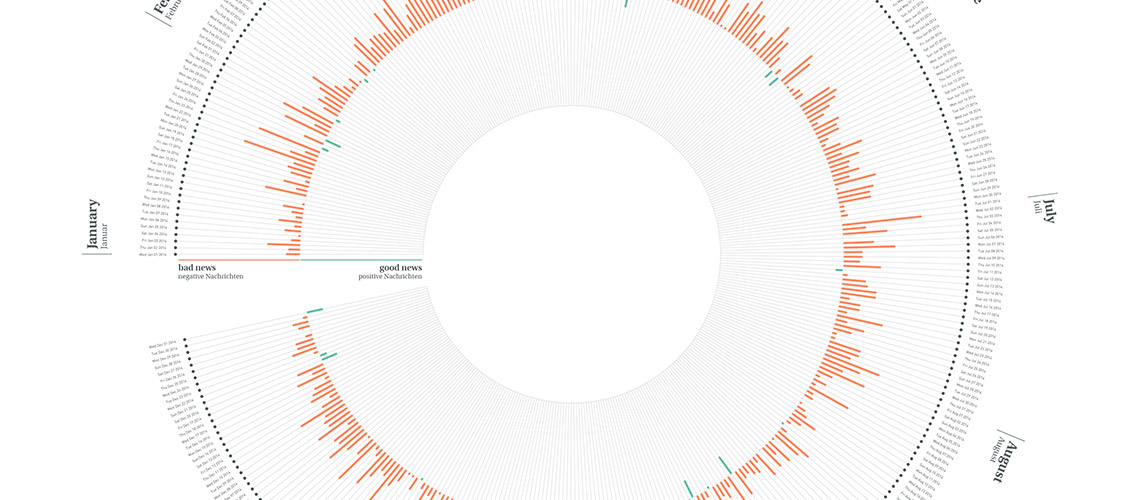
Observing the newspapers or TV news, one can find it striking that news usually involves the distribution of negative occurrences, like climate change, crimes, terror, corruption and all sorts of scandals. One could think that the world is a comprehensive cluster of negative features. Even though this reductionist impression of the world is untenable, it does lead into the discussion on why news companies tend to focus on bad news.
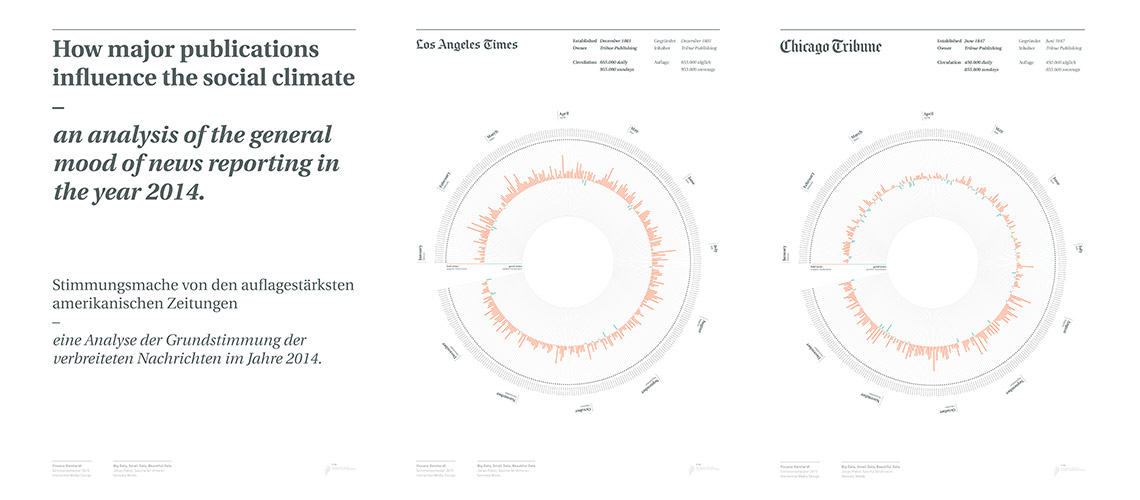
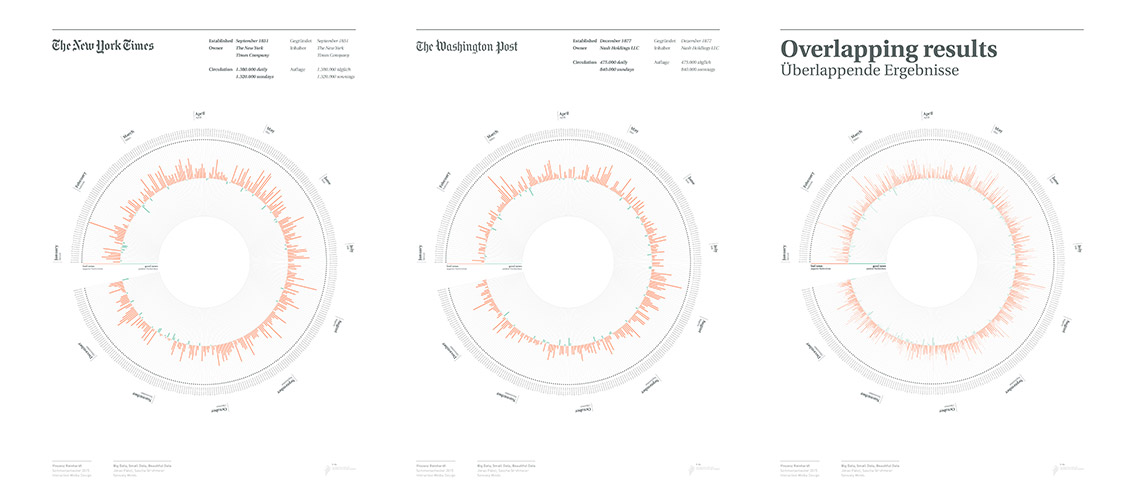
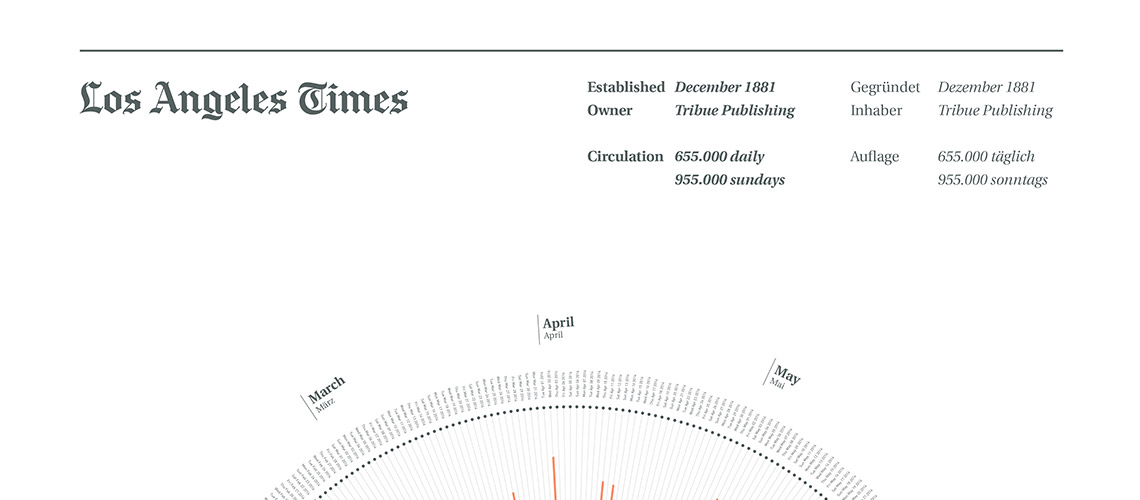
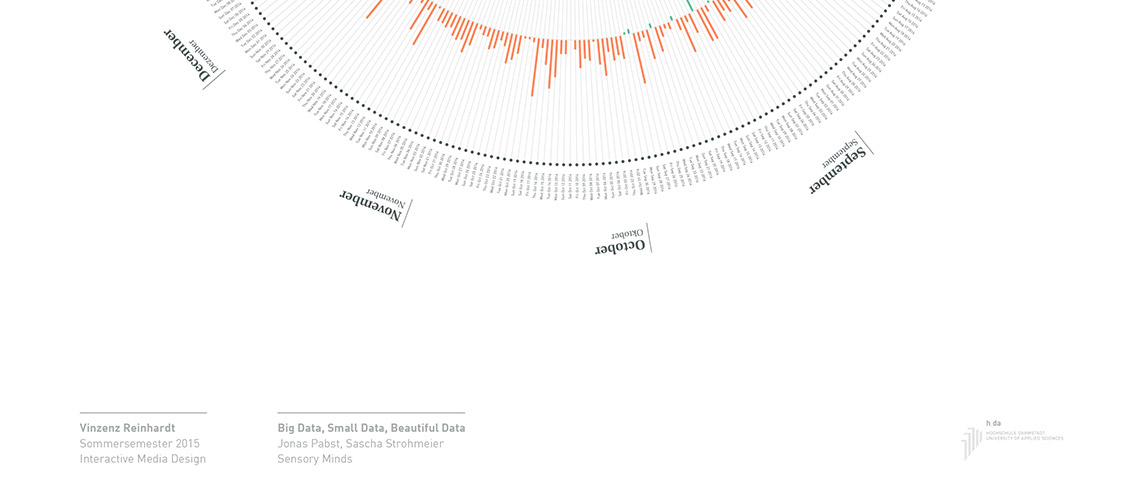
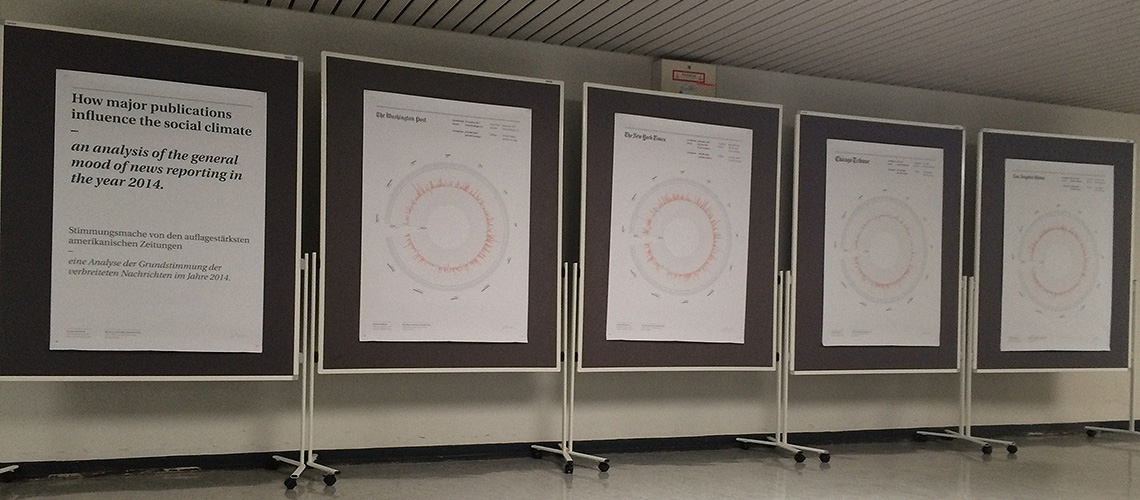
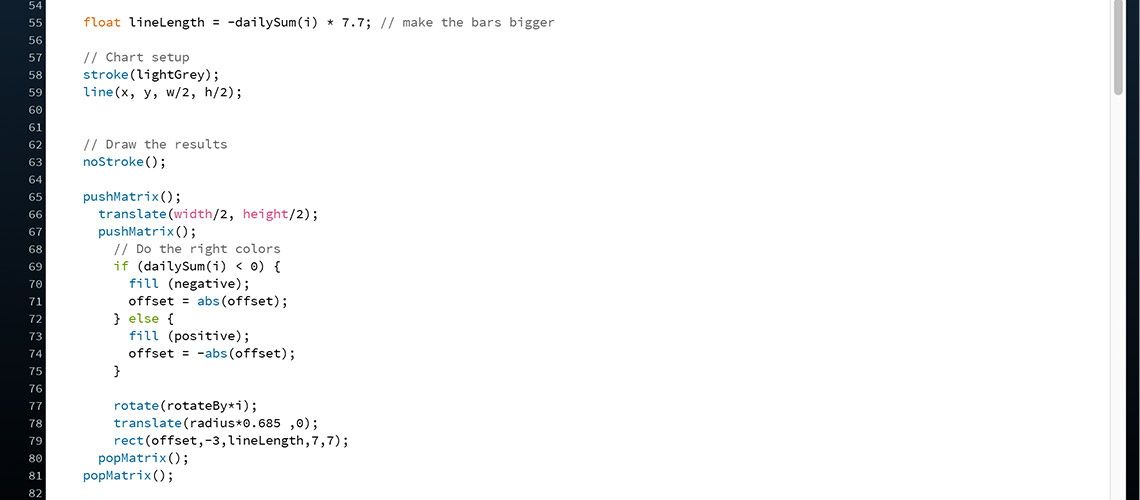
DYSTOPIA visualises the usage of positively and negatively charged words of major US newspapers. One pillar indicates the summed up value of negative and positive keywords, found in the title of the news on a particular day. The values are presented in a circular form which represents the entire year 2014. DYSTOPIA consists of five diagrams, each printed on A0 paper
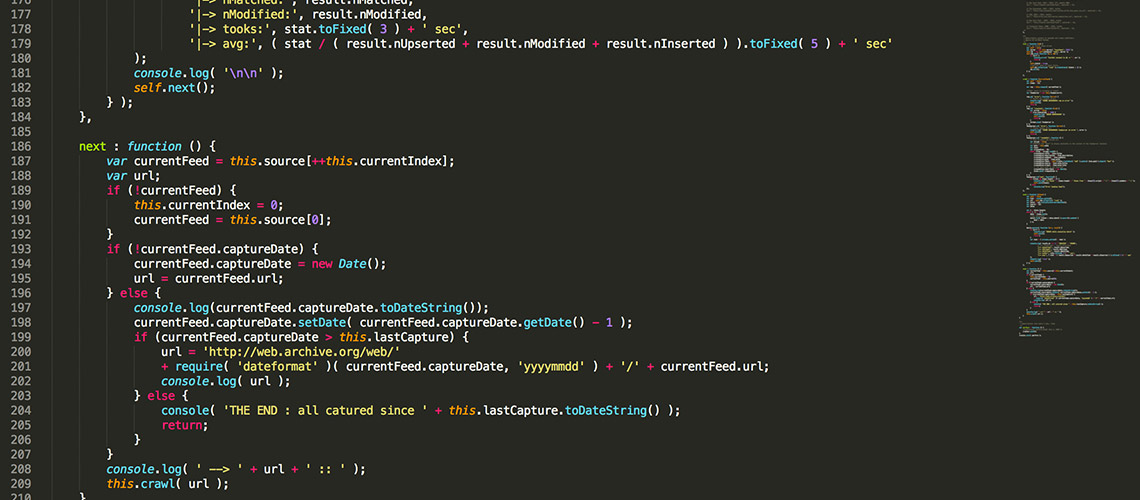
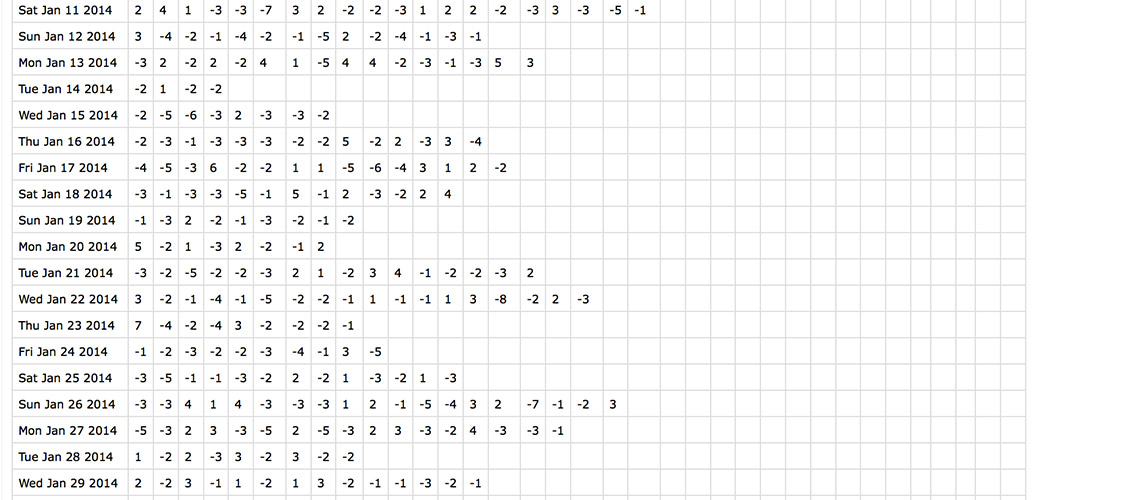
The required data was accumulated using a crawler, extracting data from archive.org's Wayback Machine, which archives a daily snapshot of popular websites. The language analysis used a dataset from Finn Årup Nielsen. He classified 2477 words from very bad (-5) to very good (+5). Words like "kill", "destroy" or "fraud" get negative values, whereas words like "outstanding", "happy" or "miracle" get positive values.
Through DYSTOPIA I learned basic data visualisation techniques using Processing. Furthermore, I learned basic node.js in order to develop the crawler in order to accumulate relevant data for the diagrams.